Dividend Portfolio Investment Tracker
An investment tracker for a dividend portfolio: holdings, cost basis, gain and allocation against your target, with 3 charts. XLSX with a blank copy.
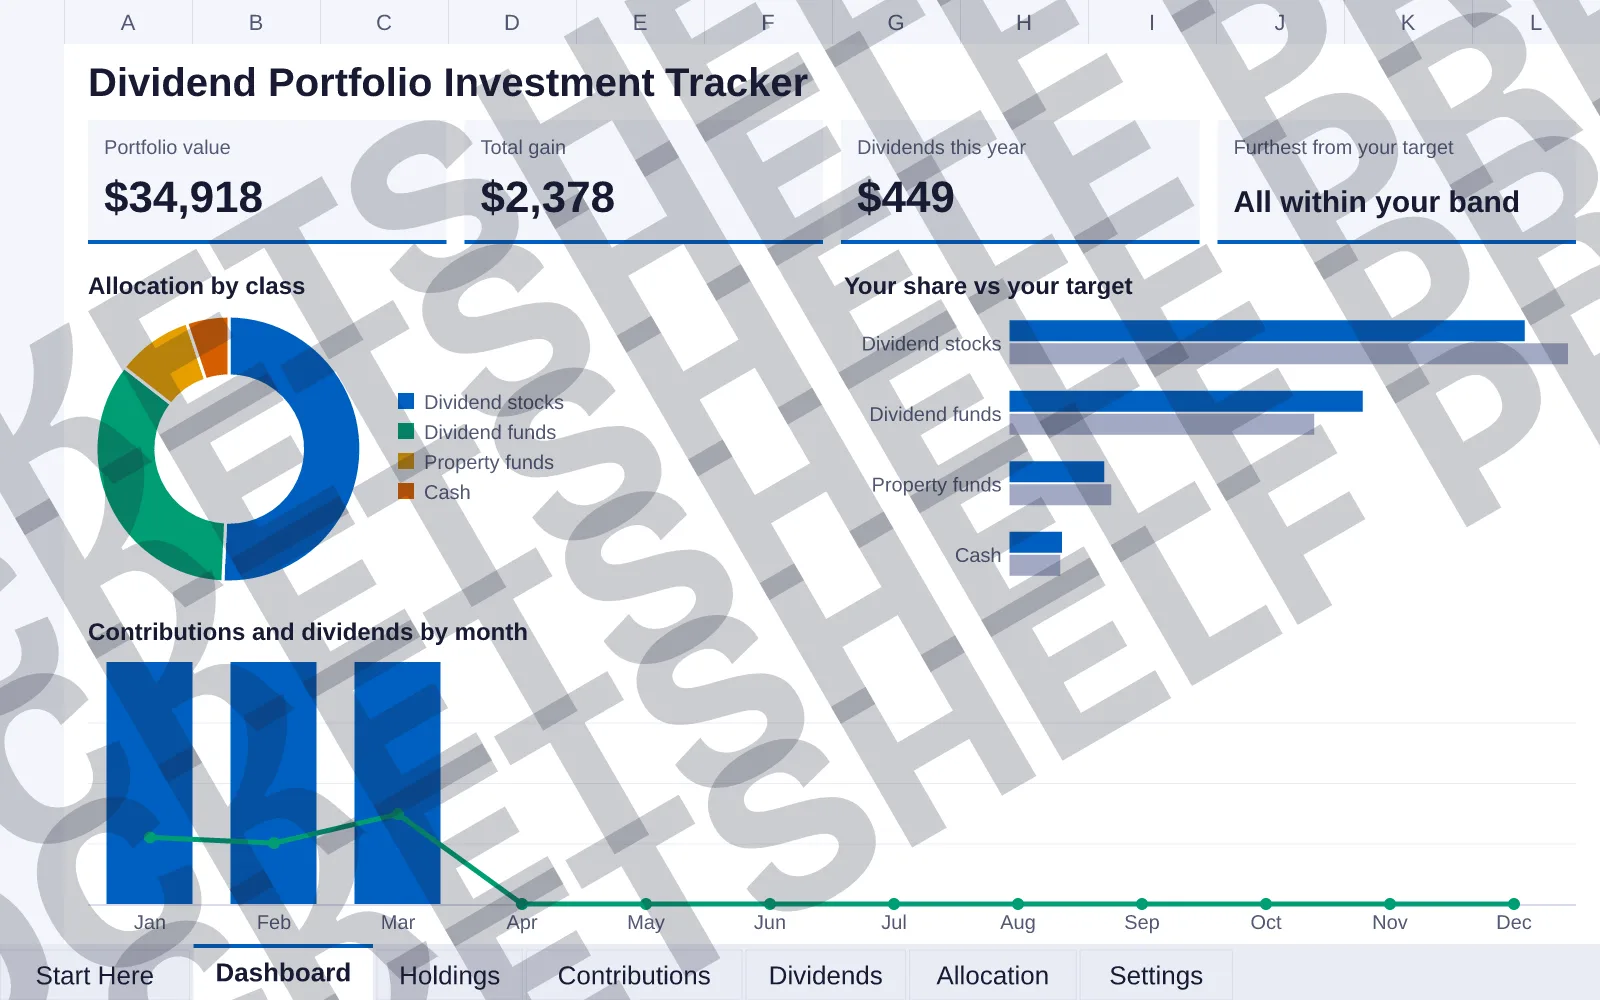


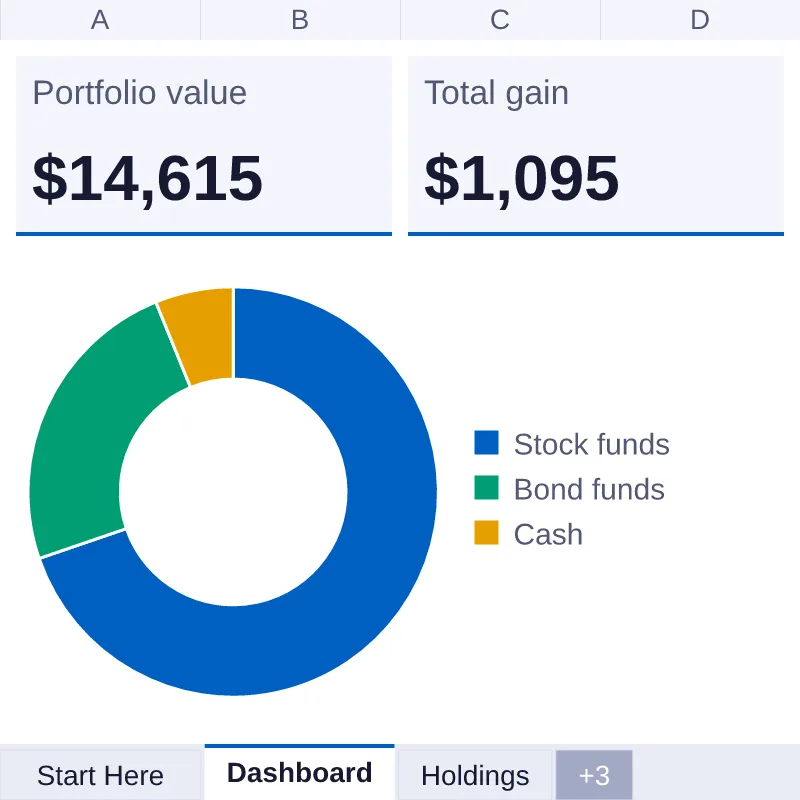
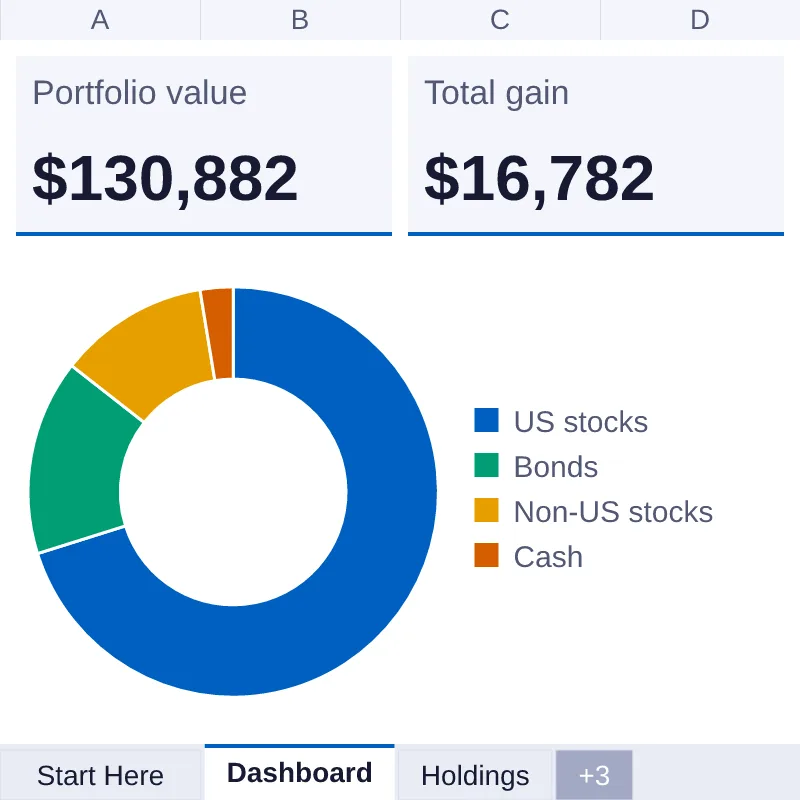
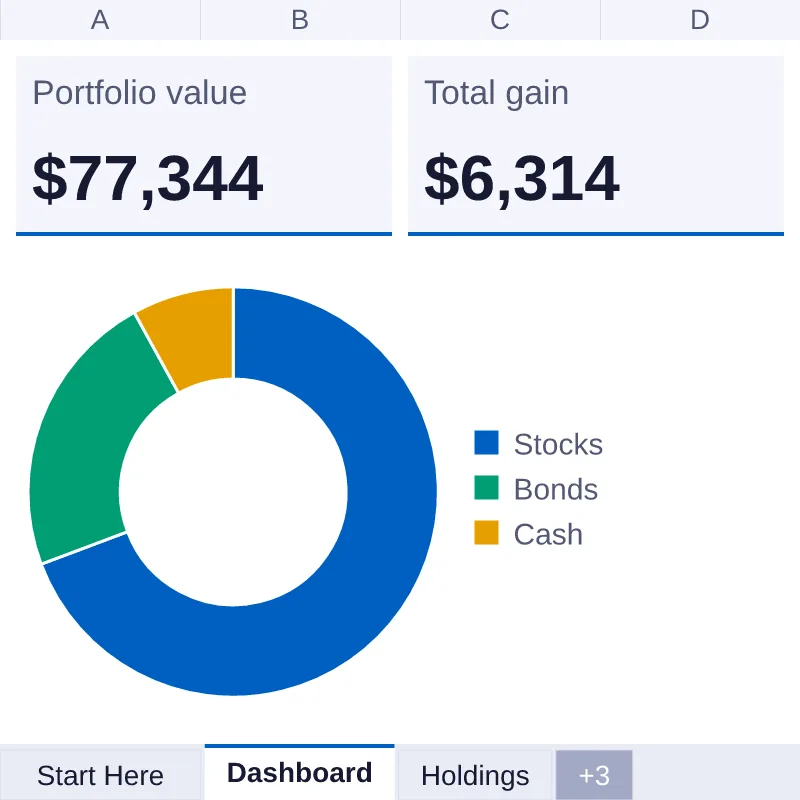
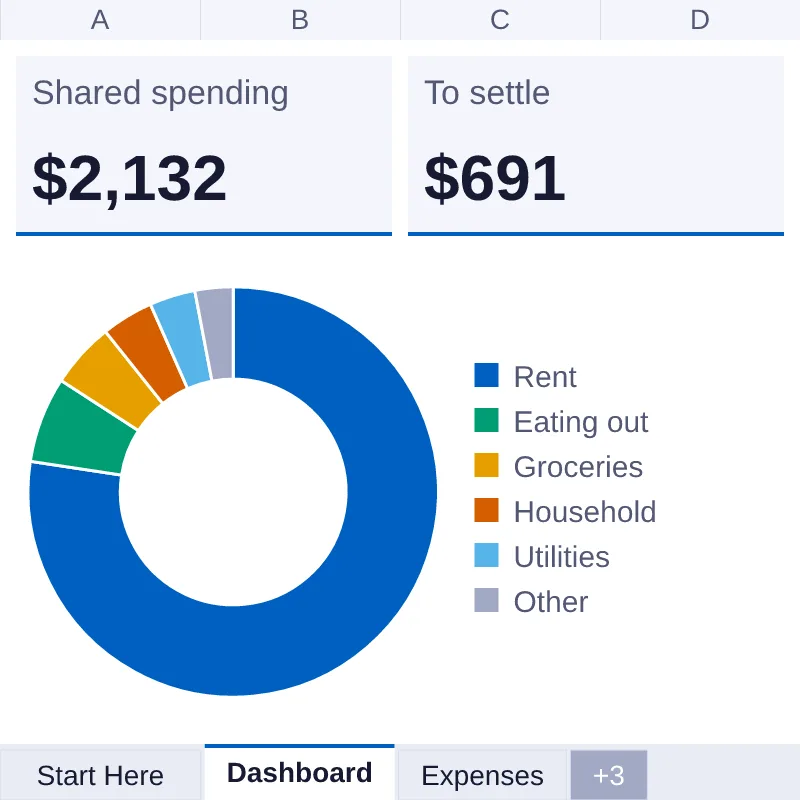
DashboardPreviews of the Dashboard, Holdings, Allocation and Contributions tabs with sample data, drawn from the file. Fonts and chart styling can differ in Excel, Numbers and Google Sheets.
View full size (opens image)What's inside
- Format
- XLSX, CSV
- Contents
- 7 tabs · 3 charts
- Version
- 1.1 · Updated 7 Oct 2026
- Licence
- Personal What this means
- Checked
- Checked before it ships
- dividend-portfolio-investment-tracker.xlsxXLSX · 76 KB
- dividend-portfolio-investment-tracker-blank.xlsxXLSX · 74 KB
- dividend-portfolio-investment-tracker.csvCSV · 986 B
- LICENSE.txtadded to every download
About this item
An investment tracker for a dividend portfolio. It has 7 tabs: Start Here, Dashboard, Holdings, Contributions, Dividends, Allocation, Settings. Type each holding with its units, what you paid and today's price; nothing updates prices by itself, so you type the price and its date. The Dashboard with 3 charts shows your portfolio value ($34,918 in the sample data), your total gain, the dividends you received this year and which asset class is furthest from the target you set. Allocation compares your share in each class with your own target and says Above your target, Below your target or Within your band. The Dividends tab logs each payment, and Holdings shows each holding's yield on cost from the last 12 months of payments. It tracks your numbers; it is not financial advice. You get two files: one with sample data so you can see it working, and a blank copy with the same formulas. Nothing is password-locked. Made for Excel (XLSX).
- Portfolio
- Tracker
- Investments
- Spreadsheet
- Allocation
- Dividend
- Personal finance
Reviews
No reviews yet.